
Global buyers increasingly view AG cover lens as a functional interface, not merely a protective glass sheet. It must resist fingerprints, reduce reflections, preserve touch accuracy, and remain visually clear under changing light. A warehouse display, for example, may face harsh LEDs, dust, repeated cleaning, and constant handling. The right surface treatment must survive all of them.
Glass scientist Dr. James E. Shelby has expressed a practical principle: “Glass performance depends on composition, processing, and application.” This idea fits AG cover lens selection closely. A matte finish that works well on an indoor control panel may appear too hazy on a vehicle display. A strong anti-glare layer may reduce reflections, yet slightly affect image contrast. Details matter.
No coating is flawless.
Experienced buyers therefore examine more than sample appearance. They review haze values, gloss levels, surface hardness, chemical resistance, optical transmission, and touch performance. They also ask how the lens behaves after repeated wiping. This is where supplier experience becomes visible. Consistent etching, precise dimensional control, clean edge finishing, and stable quality records can reduce costly surprises.
However, specifications alone do not guarantee success. A product may pass laboratory tests but perform poorly in a real installation. Lighting angle, viewing distance, protective films, and assembly pressure can change the result. Global buyers should request application-specific samples and independent test evidence. Careful validation takes more time, but it supports safer decisions, steadier quality, and better long-term value when choosing an AG cover lens supplier.
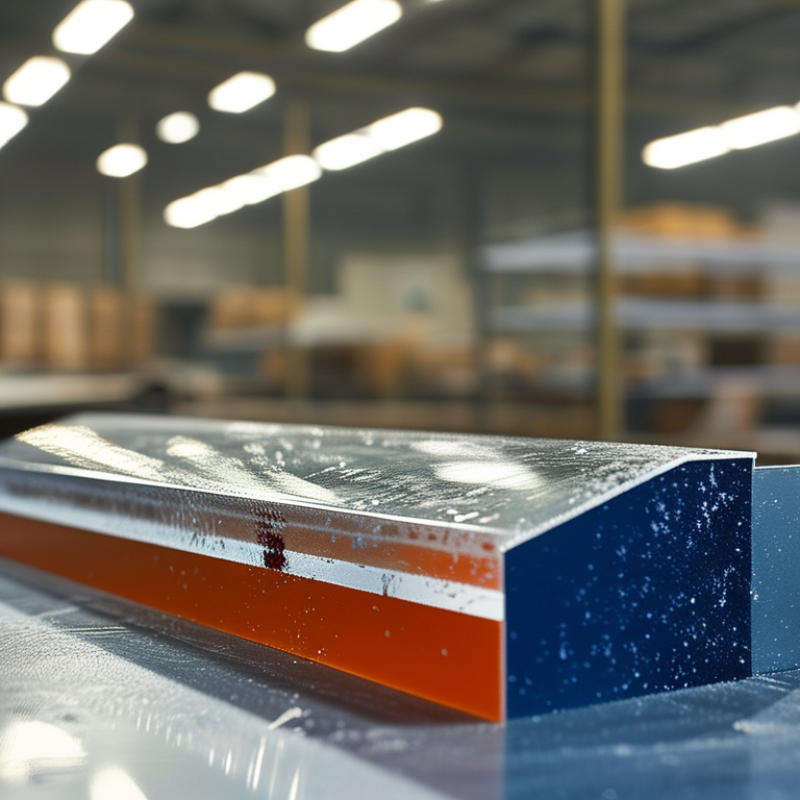
An AG cover lens is a protective glass panel with an anti-glare surface. AG means anti-glare. Its micro-textured or coated finish scatters reflected light from lamps, windows, and sunlight. This makes displayed images easier to view at different angles. Unlike ordinary cover glass, it manages surface reflection as well as impact protection. The surface may use chemical strengthening, etched patterns, or a thin functional coating.
The demand is practical, not cosmetic. IDC’s Worldwide Quarterly Mobile Phone Tracker reported about 1.23 billion smartphone shipments worldwide in 2024. Each device may face bright offices, outdoor sunlight, fingerprints, and repeated cleaning. An AG lens can reduce mirror-like reflections, but it may slightly soften image sharpness or reduce perceived contrast. That trade-off is easy to underestimate. A lower-gloss surface can also show a fine texture under close inspection.
Professional evaluation should measure more than appearance. ISO 14782 provides a method for measuring haze, while ISO 13468-1 addresses luminous transmittance. Buyers should also review gloss, surface hardness, touch sensitivity, abrasion resistance, and optical uniformity. No single haze value proves better performance. In real production, uneven texture can create cloudy patches around curved edges. This is where supplier experience matters: inspect samples under cool white LEDs, direct sunlight, and a black display image. Laboratory results help, but actual viewing conditions can disagree. That uncomfortable gap deserves attention.
Why Choose AG Cover Lens for Global Buyers?
Anti-glare technology changes how light behaves on a cover lens. A standard smooth surface reflects light directly toward the viewer. This creates bright spots from windows, ceiling lamps, or sunlight. An AG surface uses microscopic textures to scatter reflected light across a wider angle. The reflection becomes softer and less distracting.
The effect is practical. Text remains easier to read in a bright office or outdoor setting. Fingerprints and small smudges may also appear less obvious. However, anti-glare is not magic. Excessive surface roughness can slightly reduce sharpness or make dark images look hazy. The best balance depends on viewing distance, display brightness, and application type.
Reliable production requires more than applying a matte coating. Engineers should control texture uniformity, haze, transmission, hardness, and abrasion resistance. These properties need measurement under repeatable conditions. In real use, we also inspect lenses under different lighting angles. A laboratory result may not match a user’s experience. That gap deserves attention. For global buyers, consistent specifications and traceable quality checks can reduce installation risks. Protective packaging matters too, because surface damage can affect optical performance before assembly. A well-designed AG cover lens should control glare while preserving touch response, color visibility, and everyday durability.
The chart shows the calculated average Fresnel reflectance from one air-to-glass surface at different light-incidence angles. Anti-glare microtexture does not remove reflected energy; it spreads concentrated specular reflection into a wider, softer distribution, helping reduce visible glare and bright reflection hotspots.
Data basis: Fresnel-equation calculation for an air-to-glass interface using refractive indices of 1.00 and 1.50. Values represent the average of s- and p-polarized reflectance from one surface.
An AG cover lens begins with the right substrate. Aluminosilicate glass offers high strength and good optical stability. Borosilicate glass performs well under thermal changes. Soda-lime glass can reduce cost for less demanding applications. Material selection depends on thickness, display size, impact needs, and operating temperature. A careful supplier should share measurable data, not vague claims.
Anti-glare performance usually comes from chemical etching, surface coating, or both. Chemical etching creates controlled microscopic texture on the glass. This texture scatters reflected light and reduces harsh images under office lamps or sunlight. Coatings can improve haze control, but they may require stricter cleaning and curing conditions. Surface texture matters. Too much haze weakens image clarity.
Manufacturing includes cutting, CNC edge processing, washing, printing, strengthening, and final inspection. Tempering or chemical strengthening can improve durability after shaping. Operators should check haze, gloss, transmittance, surface defects, dimensions, and touch sensitivity. Digital measurement helps, but visual inspection still catches tiny particles and pinholes. Small flaws remain. That is worth admitting. Process reviews and sample testing help reduce them. For global buyers, traceable records, stable packaging, and clear tolerance control are as important as the lens itself. A reliable production partner should provide test methods, inspection reports, and samples that match mass-production results.
AG cover lenses reduce mirror-like reflections from windows, lamps, and overhead lighting. This matters in offices, vehicles, kiosks, and outdoor terminals. The 2024 Global Display Market Outlook from Omdia identifies readability under changing light as a key display requirement. A matte micro-texture can scatter reflected light across the surface. Text stays easier to read. Eyes may also experience less visual strain during long viewing sessions.
The benefit depends on controlled optical values. Buyers should compare haze, total transmittance, gloss, surface hardness, and pencil-resistance results. ISO 9241-307 provides a useful framework for evaluating visual ergonomics and display performance. A lens with excessive haze can make black text appear gray. That is not a small problem. It can weaken contrast and reduce perceived image sharpness. In practical testing, inspect white screens, dark images, and fine text under direct lamps.
Durability also affects global ownership costs. The Global E-waste Monitor 2024 reports 62 million tonnes of electronic waste generated in 2022. Longer-lasting cover lenses can help reduce avoidable screen replacements, although material choice alone cannot solve e-waste. Humidity, abrasion, cleaning chemicals, and temperature cycling still require validation. Some AG surfaces feel slightly grainy. That trade-off deserves honest testing before large-volume purchasing.
Why Choose AG Cover Lens for Global Buyers?
Choosing the right AG cover lens starts with the market, not the factory catalog. IDC’s Worldwide Quarterly Mobile Phone Tracker recorded about 1.24 billion smartphone shipments in 2024. That scale hides major regional differences. Outdoor users need stronger glare control and higher visible transmittance. Office users may prefer lower haze and sharper text. A lens that performs well in cloudy Europe can feel too reflective in bright Gulf environments.
Check haze, gloss, transmittance, surface hardness, and coating durability together. High haze reduces mirror-like reflections, but excessive haze can soften icons and small fonts. For vehicle displays, automotive-grade testing and stable optical performance matter. For handheld devices, thinness, fingerprint resistance, and drop performance usually carry more weight. GSMA’s Mobile Economy 2024 report projects 5.5 billion mobile subscribers by 2030, increasing the need for region-specific display design. One global specification may be efficient, but it is not always the best choice.
Tips: Request samples under real lighting conditions. Test direct sunlight, fluorescent offices, and night driving. Compare 2–3 haze levels. Measure readability with local scripts, not only English. Confirm abrasion and humidity results from recognized laboratory methods. Also question marketing claims. A lower haze value is not automatically better. In practice, small compromises often improve the user experience. That deserves careful review.
| Market / Application Environment | Typical Ambient-Light Challenge | Recommended AG Surface Level | Suggested Haze Range* | Optical Priority | Recommended Surface Finish | Key Selection Considerations |
|---|---|---|---|---|---|---|
| North America | Bright offices, retail lighting, vehicle displays, and direct window reflections. | Medium AG for general displays; higher AG for outdoor or transportation applications. | 3%–8% for general indoor use; 8%–15% for stronger reflection control. | Balance reflection reduction, sharp text, and high image contrast. | Fine matte texture with controlled sparkle. | Check readability under LED lighting, resistance to fingerprints, and compatibility with touch operation. |
| Europe | Large glazed buildings, strong daylight variation, and sustainability-focused product requirements. | Low-to-medium AG for office and professional displays; medium AG for public-facing equipment. | 2%–7% for professional indoor displays; 5%–12% for high-glare locations. | Low sparkle, consistent appearance, and stable optical performance. | Uniform fine matte finish with low visual grain. | Evaluate chemical resistance, cleanability, recycled-content options, and documentation for applicable EU requirements. |
| East Asia | Dense indoor lighting, digital signage, compact consumer electronics, and frequent close-range viewing. | Low AG for high pixel-density screens; medium AG for signage and shared-use devices. | 1%–5% for close-viewing displays; 4%–10% for public signage. | Preserve resolution, text clarity, touch precision, and color neutrality. | Very fine matte texture with carefully controlled haze. | Test moiré, sparkle, Newton-ring risk in laminated structures, and optical uniformity across the full panel. |
| South Asia & Southeast Asia | High daylight intensity, humid conditions, dust, fingerprints, and mixed indoor-outdoor use. | Medium AG for indoor equipment; medium-to-high AG for kiosks and semi-outdoor displays. | 4%–10% for indoor use; 8%–15% for brighter environments. | Reflection control together with durability and easy cleaning. | Durable matte finish, optionally combined with an oleophobic or easy-clean top layer. | Verify humidity resistance, adhesion after temperature cycling, abrasion resistance, and performance after repeated cleaning. |
| Middle East & Africa | Intense sunlight, high solar load, dust, sand particles, and strong contrast between indoor and outdoor areas. | Medium-to-high AG for outdoor-facing equipment and transport displays. | 8%–18%, subject to acceptable image sharpness and sparkle limits. | Minimize mirror reflections while maintaining sufficient transmission and contrast. | Hard, fine matte surface with strong abrasion and contamination resistance. | Consider UV exposure, thermal cycling, sand abrasion, dust accumulation, and readability in direct sunlight. |
| Latin America | Strong daylight, variable infrastructure, retail glare, and a wide range of indoor installation conditions. | Medium AG as a versatile starting point; higher AG for bright storefronts and public kiosks. | 4%–10% for general applications; 8%–15% for high-glare sites. | Reliable reflection control with practical cost and durability. | Standard fine matte finish with easy-clean treatment where required. | Confirm local cleaning practices, replacement-cycle expectations, touch sensitivity, and availability of suitable thicknesses. |
| Technical Dimension | Common Evaluation Range or Target | Why It Matters to Global Buyers | Recommended Verification Method |
|---|---|---|---|
| Surface Haze | Approximately 1%–18%, depending on the required reflection control and image clarity. | Higher haze can reduce visible reflections but may increase image softness, sparkle, or grain. | Measure according to ASTM D1003 or ISO 14782 and compare samples under real lighting. |
| Gloss Level | Often selected below standard polished-glass levels; the exact target depends on the surface texture and viewing distance. | Lower gloss generally reduces mirror-like reflections, while excessive matting can affect visual sharpness. | Use a gloss meter at the agreed measurement angle and define an acceptance tolerance. |
| Visible Light Transmission | Commonly targeted above 88% for display cover applications, subject to glass type, thickness, printing, and coatings. | Higher transmission supports screen brightness, color reproduction, and energy efficiency. | Measure spectral transmission with a calibrated spectrophotometer across the visible range. |
| Surface Hardness | 9H pencil-hardness performance is a common target for many consumer and commercial cover-lens applications, but it is not universal. | Improves resistance to scratches from handling, cleaning, and routine contact. | Test using ASTM D3363 or another mutually agreed hardness procedure. |
| Chemical Resistance | Resistance should be verified against alcohol-based cleaners, mild detergents, skin oils, and site-specific chemicals. | Cleaning agents and fingerprints can degrade coatings or change surface appearance over time. | Conduct repeated-wipe testing with the actual cleaning products and cloth materials used in the target market. |
| Abrasion Resistance | Specify a test load, number of cycles, abrasive material, and allowable change in haze or gloss. | Important for kiosks, transportation systems, retail equipment, and dusty or sandy environments. | Use an agreed abrasion test and measure optical change before and after testing. |
| Touch Compatibility | Confirm stable touch sensitivity through the selected glass thickness, surface treatment, and laminated stack. | AG texture, contamination, gloves, and water can influence touch accuracy and user experience. | Test with the final display module, touch controller, protective stack, gloves, and expected contaminants. |
| Environmental Reliability | Define temperature cycling, humidity exposure, UV exposure, and adhesion requirements according to the installation environment. | Prevents coating delamination, haze change, discoloration, and loss of surface performance during service. | Use application-specific reliability tests, such as damp heat, temperature cycling, and UV exposure. |